Market Weather Grid
Local browser engine · waiting for v2.1 measurements
Loading the sector board…
Google reference · recorded sector mediansChecking sheet
Checking the Google Sheet. Dated sector medians provide the board’s baseline while measured readings rest. Open the source sheet ↗
Overnight trace
Choose sectors & view trace
Follow up to three sectors. Line colors match the tiles.
Compare sectors
Pressure and breadth are ranked by size of movement, not direction.
Charts over time
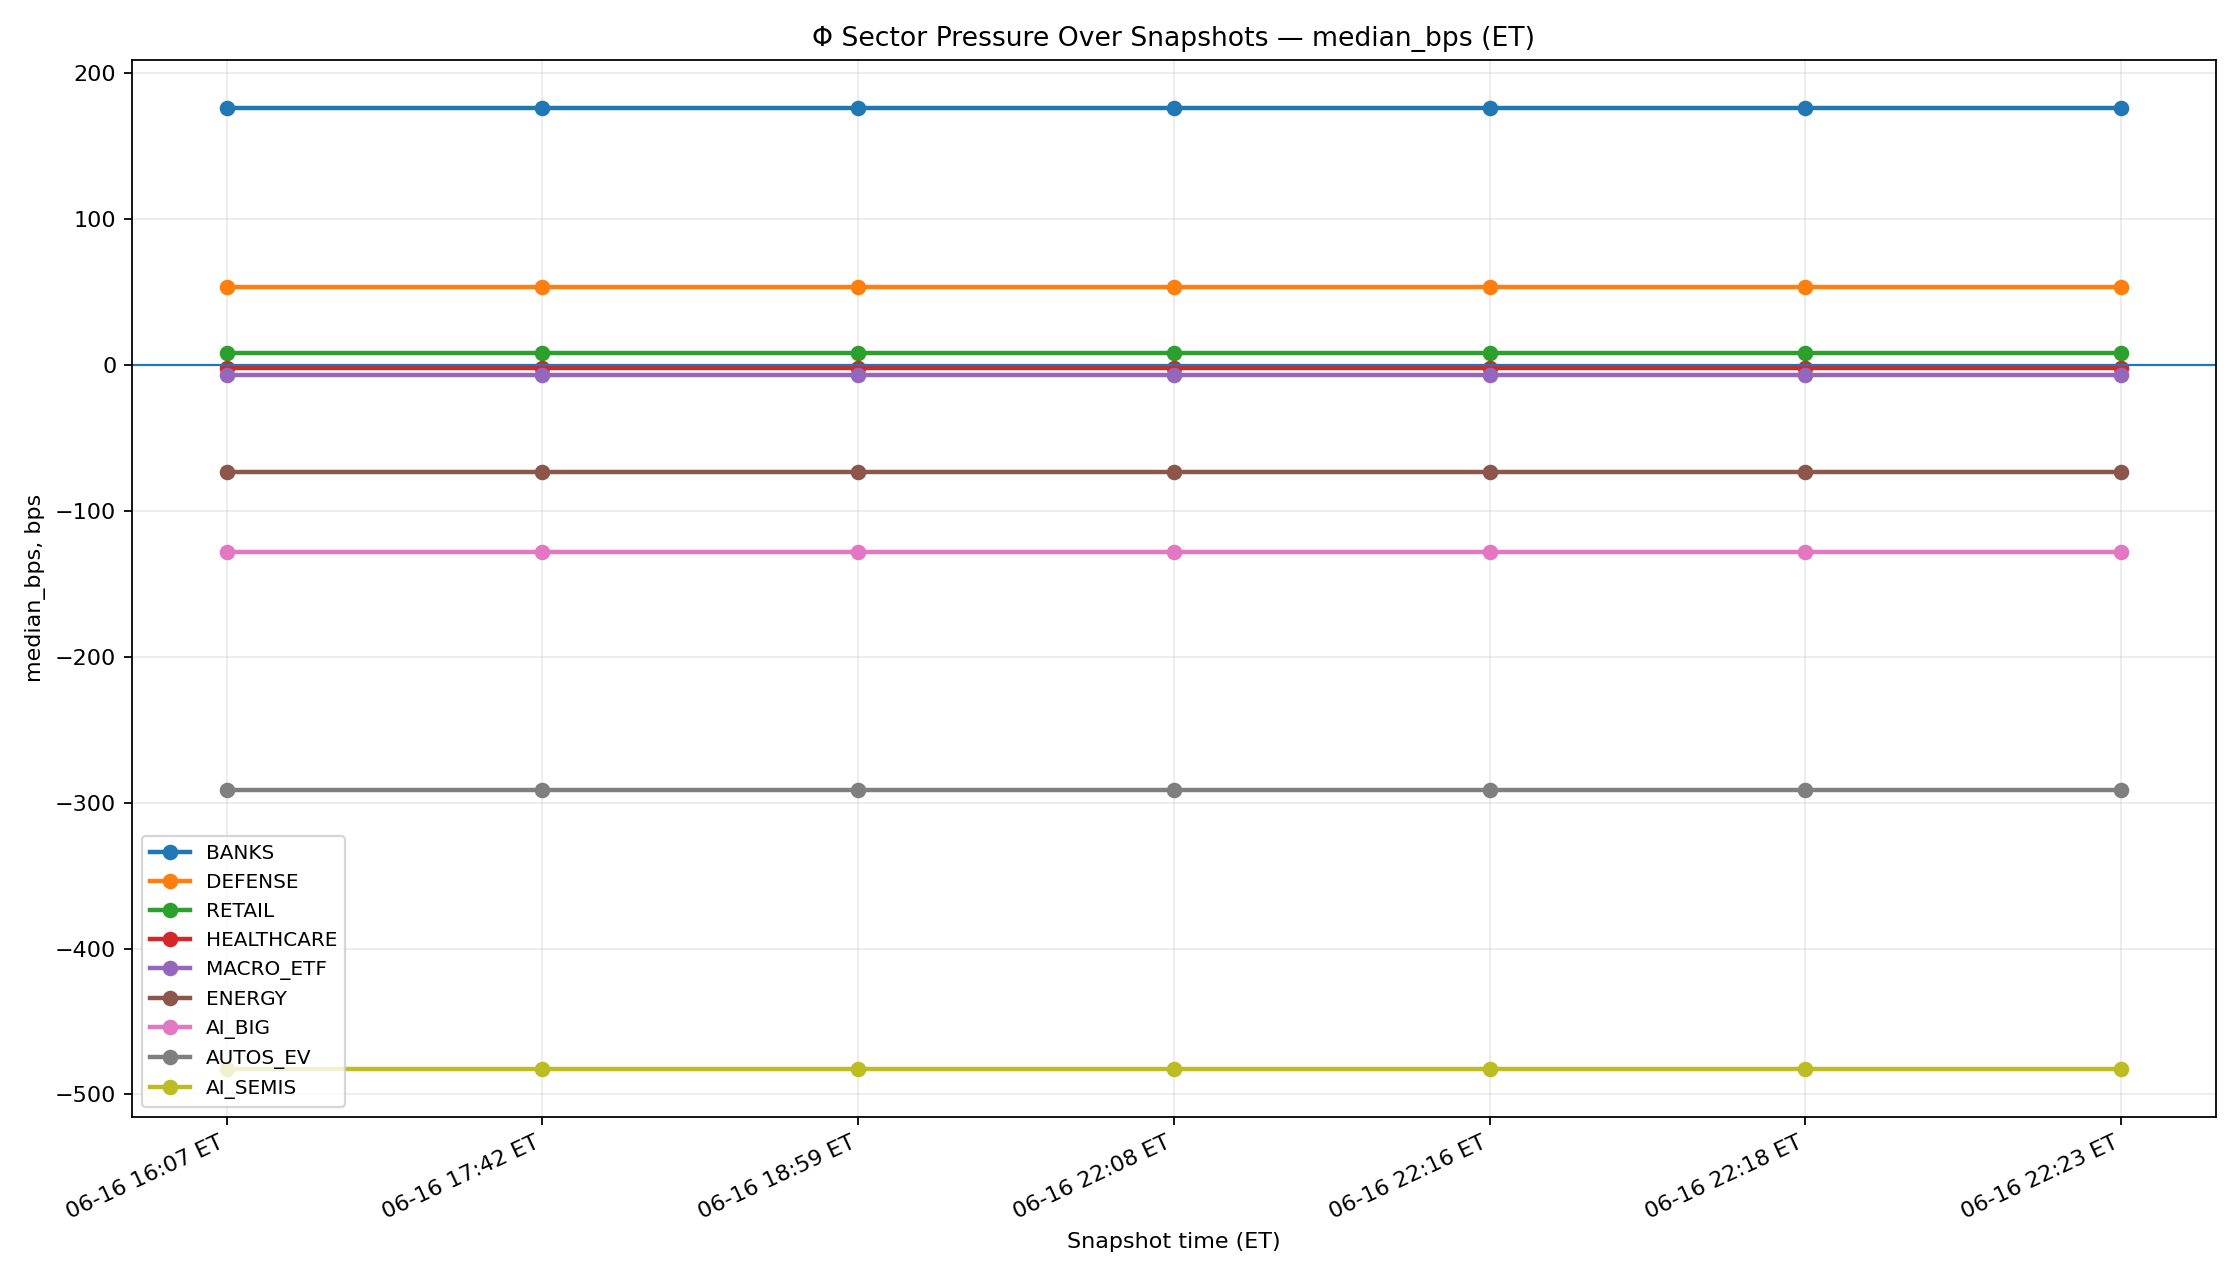
The grid answers where are the sectors now? The chart shows persistence, reversal and spread across the recorded snapshots that led here.
Open charts over time →How to read & use the board
Local weather. Your browser is the engine. Each measured contributor loses influence as its UTC quote age grows. Weather bps is an age-weighted average across the configured basket, with missing weight resting at zero while a measured reading is current. Once that reading expires, its displayed weather fades into the dated Google sector median as the remaining support declines. If Google has no usable median for a sector, its original weather decay remains in effect. The thin color bar shows effective support. This modeled value can move while the last measured price stays still.
Read. Median bps is the middle sector reading in basis points; 1 bp = 0.01 percentage point. Net breadth is the up-count minus the down-count.
Between readings. The page checks for packets every 30 seconds and recomputes local weather each second. Quote timestamps carry through refreshes, pauses and midnight. Resting tiles keep their last measured value; a dash means no saved reading. Recorded median shows the measured snapshot; the weather view fades toward the Google baseline shown on the tile. This fallback does not count as a fresh quote or change jbit movement. The three trace colors match your selected tiles.
Layout. The outer research axes are hidden on portrait phones to give the tiles more room. Sector positions and colors stay the same. CURRENT and RESTING describe the age of a reading; coverage counts show its available contributors.
Explore. Tap a tile, or focus it and press Enter or Space, to open its detail. Hold a tile to unlock the board, then move it to an adjacent square, including diagonals. Hold again to lock. Reset layout restores the original positions.
jbits · the √2 tower. Add in steps of 2. Each entry starts at 1× and follows cumulative comparable measured movement from its own starting point. Each +1 bps advances one tower step: 1 → 1.414 → 1.633 → …, approaching a 2× payout. Fractional steps are interpolated. Negative movement mirrors the curve toward zero: −1 bps pays 0.586×. This is a game multiplier, not a stock return. Clock-only weather decay cannot earn or lose jbits. Data pauses and source changes hold the value. Older holdings keep their saved value when they adopt the new curve; an existing value above 2× gets no further upside. Exit returns all entries, rounded once to the nearest 0.01 jbit. Finance holdings count toward the shared reserve; jbits have no cash value.
Sectors. Each sector summarizes a configured basket of 20 contributors. Its coverage count shows how many currently have usable readings. A sector median can change when the available sample changes; jbits follow comparable measurements between observations. Full glossary →
Data & source details
v2.1. E*TRADE supplies timestamped trades, including indicative extended-hours readings. Alpaca IEX supplements missing data; Alpaca overnight supplies indicative midpoints. Google Sheets remains an independent comparison. Equal source weights are initial tuning values, with no fitted correction applied.
Coverage and timestamps describe the available feed. The public payload contains sector aggregates, not named constituent assets. Receipts record provenance and integrity, not independent validation of prices.
Browser memory & reset
Your jbits, holdings, layouts and selections live in this browser. They are not attached to an account and do not transfer between devices.
For a clean test, close other Cerebral Graphix tabs and use Reset this browser. The reset removes this site's saved game and finance state, including jbits. It cannot be undone.