the path behind the snapshot
Market weather over time.
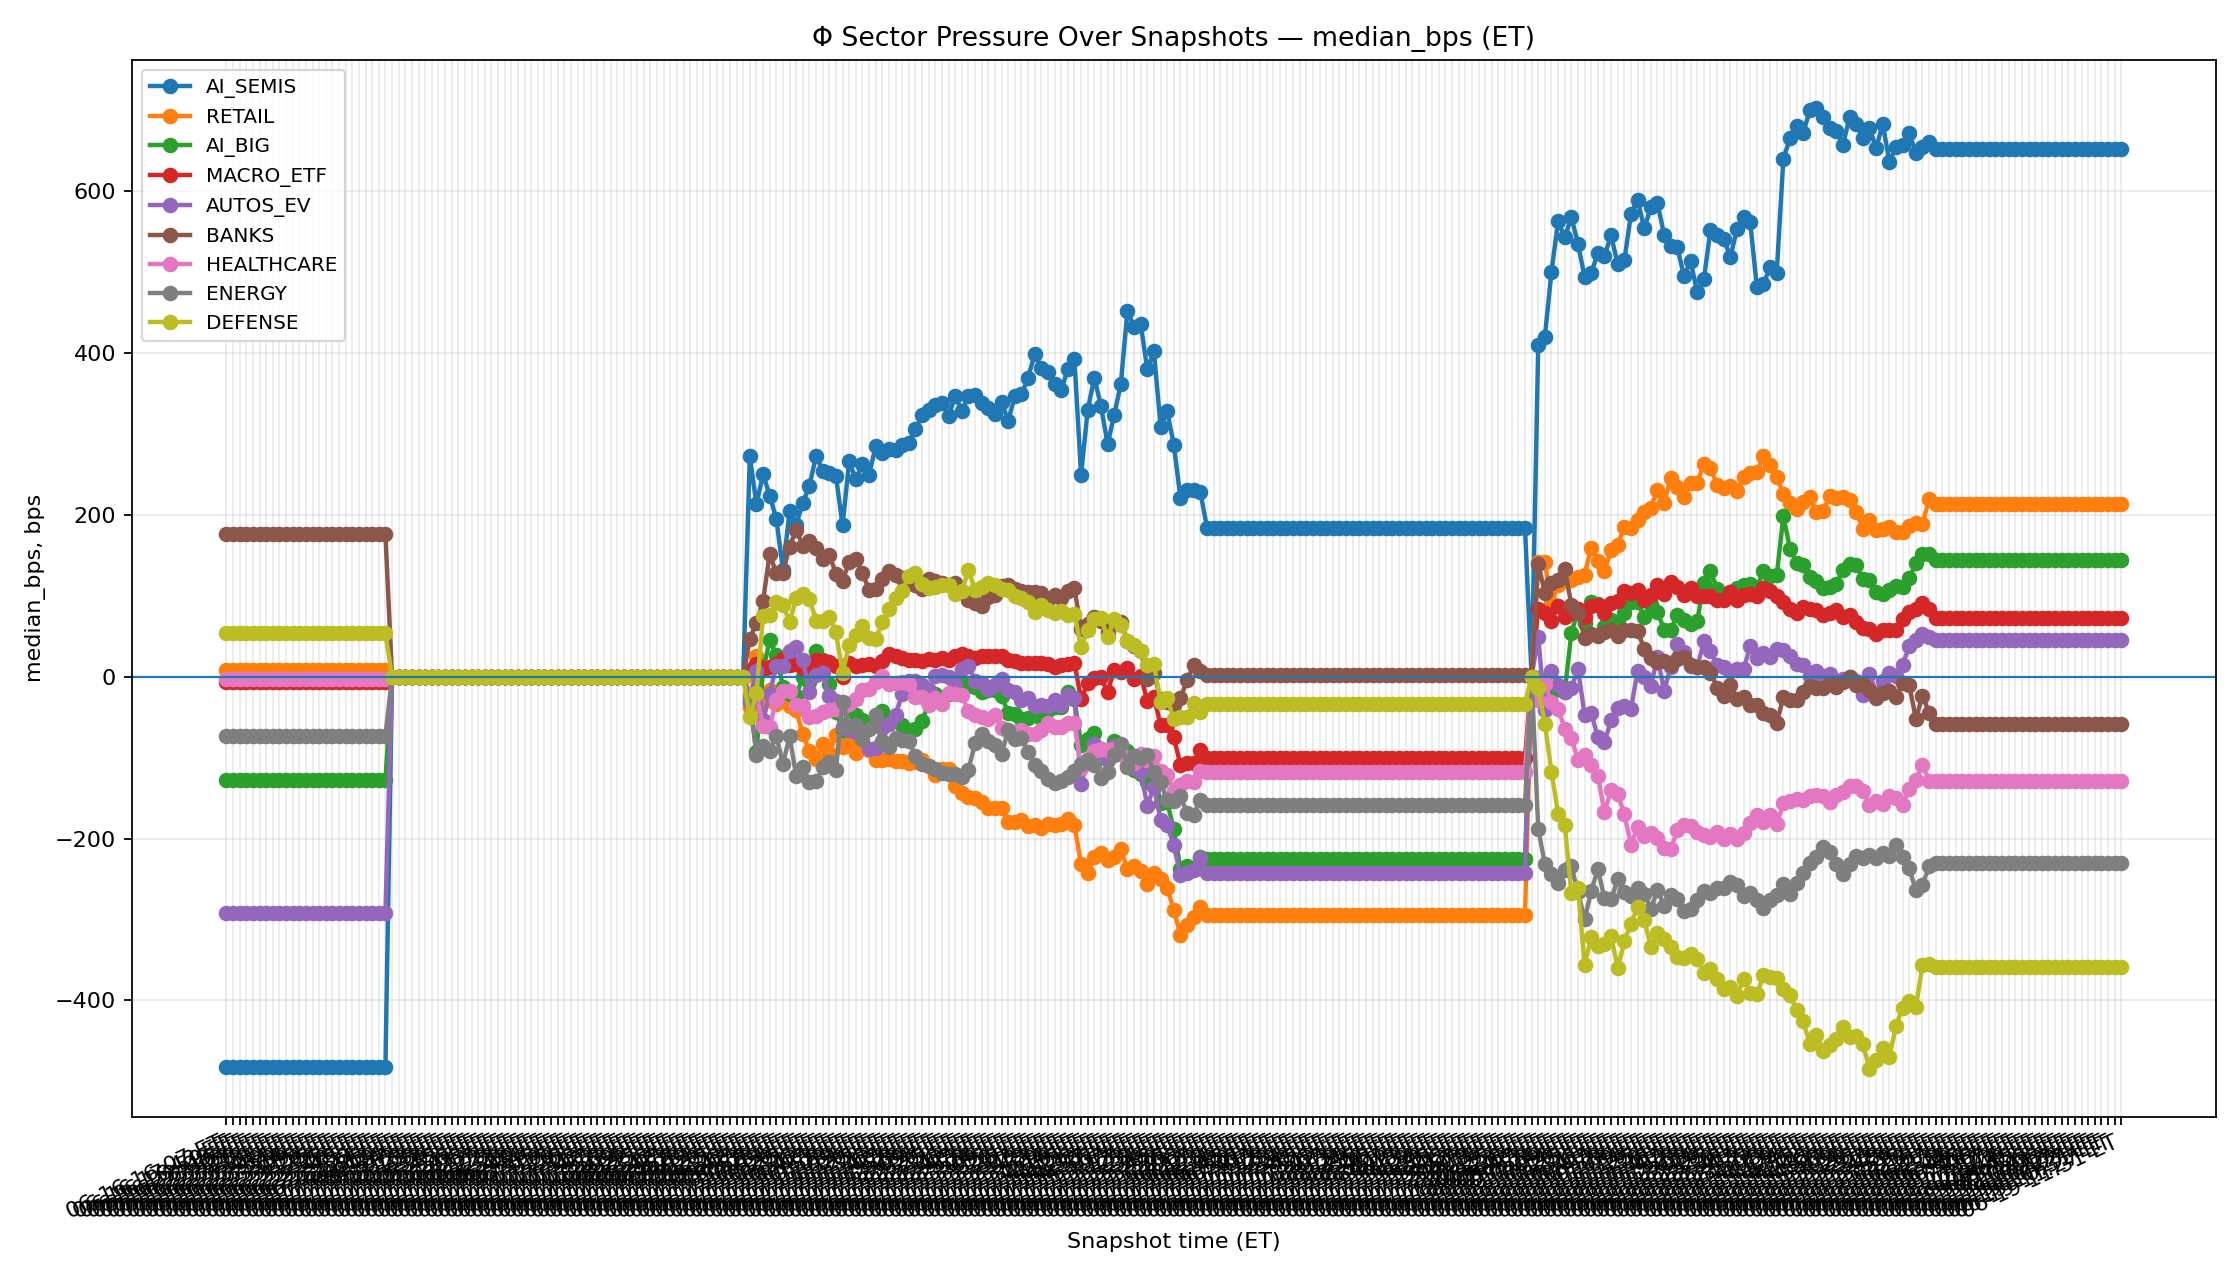
A sector can look dramatic in a single frame. The recorded sequence shows what persisted, what reversed and when the sectors began to separate.
sector pressure
Recorded snapshot sequence
Loading latest public timestamp…
Grid = positionReturn to the current board when the spatial relationship between sectors matters most.
Chart = persistenceFollow the direction and duration of sector pressure through the recorded sequence.
Two lensesMedian resists extremes; average reveals how strongly outlying readings pull the group.