public aggregate market weather
See now. Then see the path.
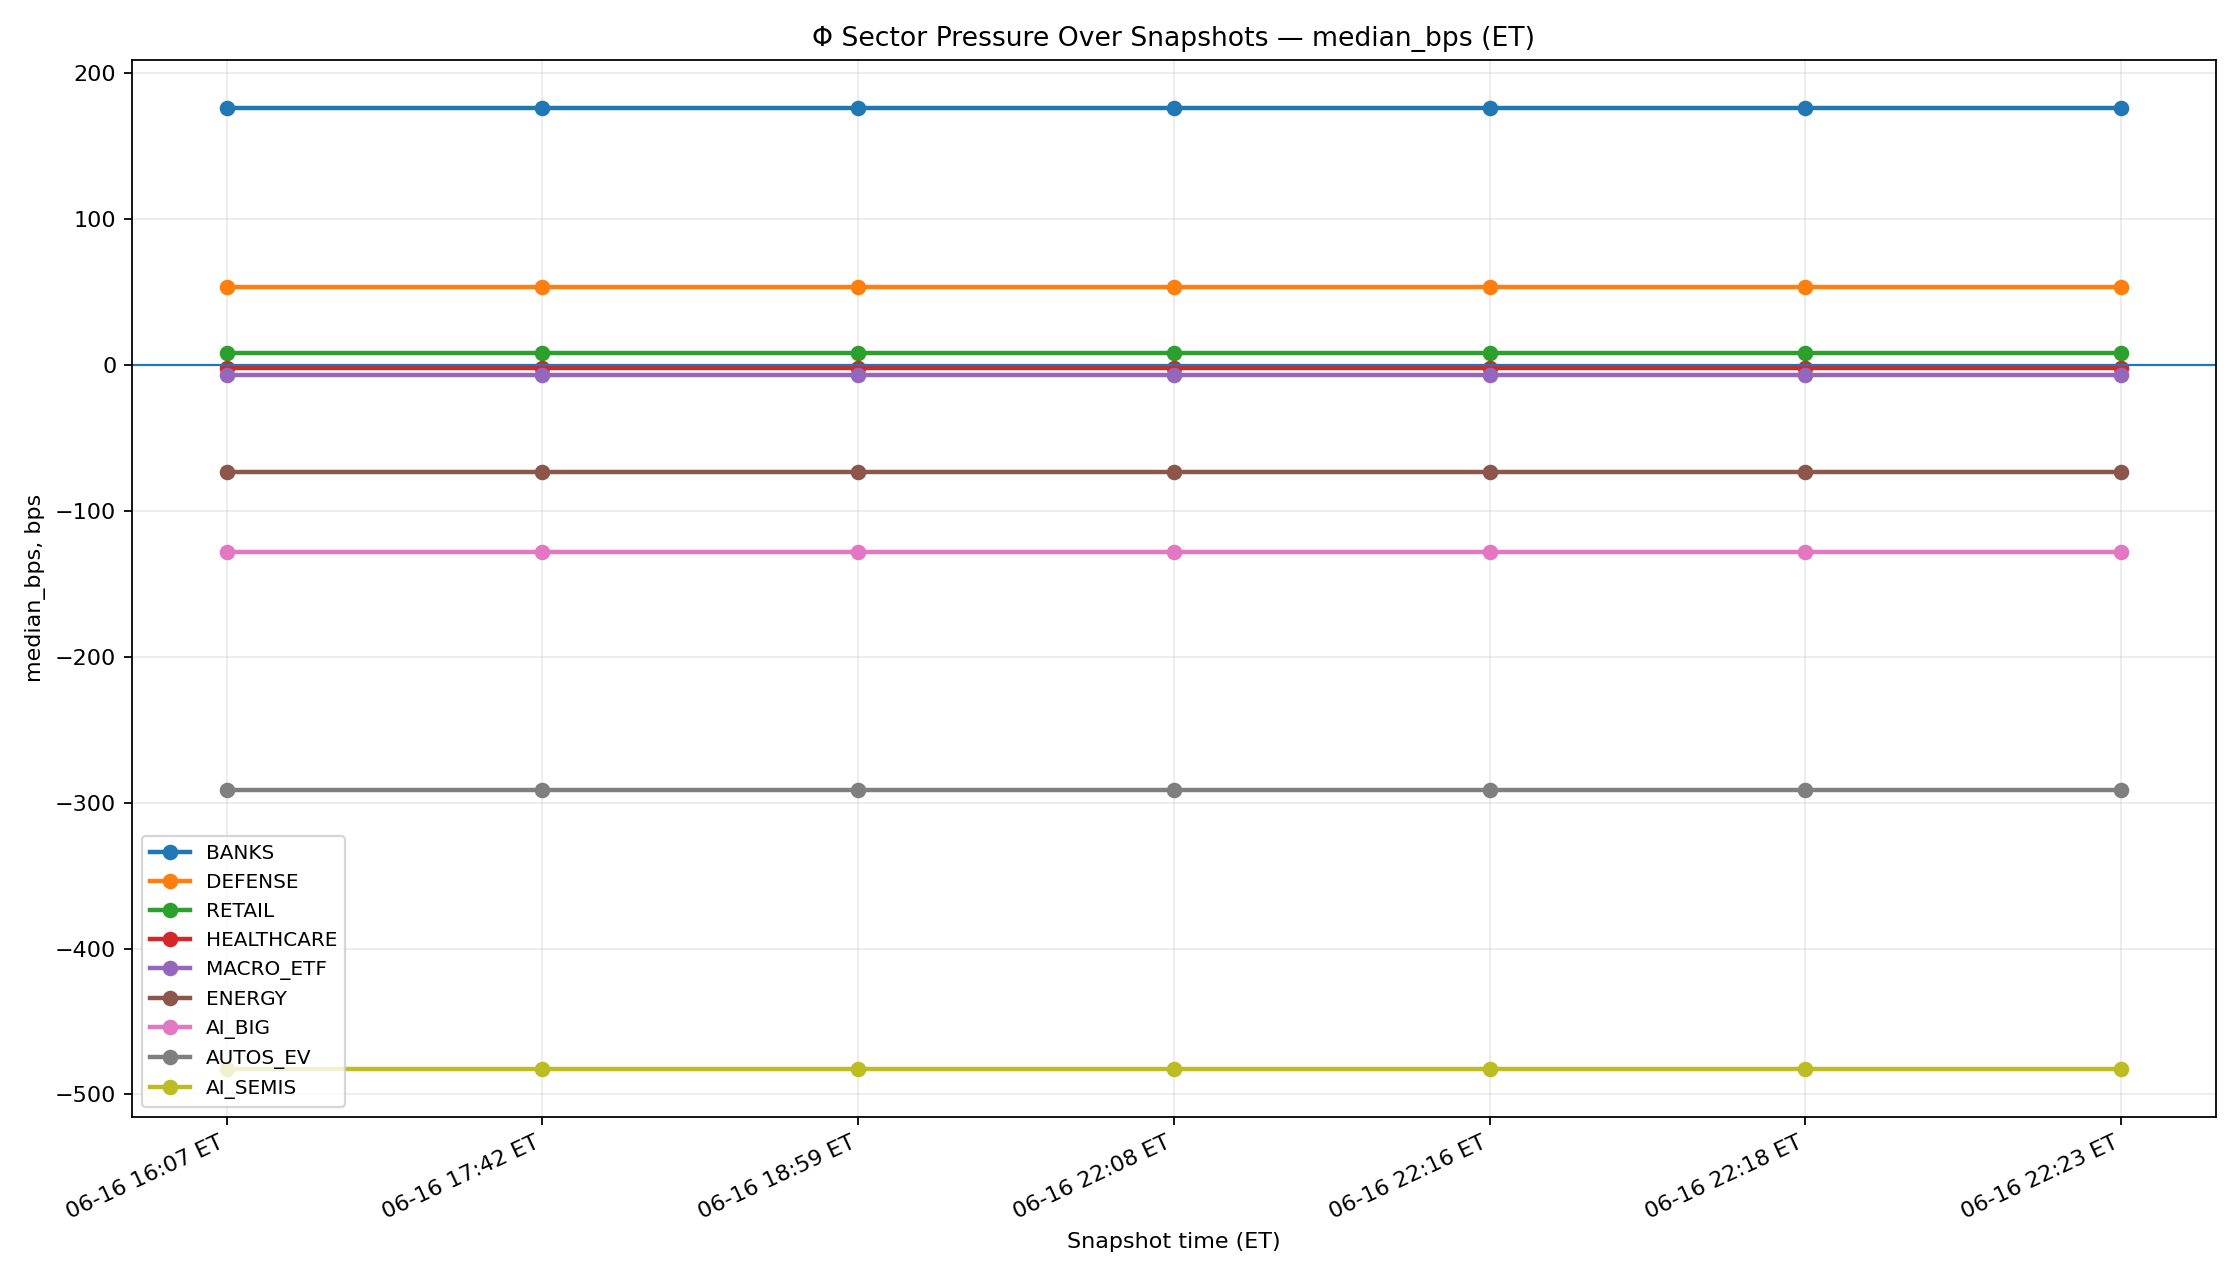
The grid holds sixteen sectors in one spatial frame. The time-series view shows whether today’s pressure is persisting, reversing or spreading.
current snapshot
The 4×4 market weather grid
Compare sector medians and breadth without rearranging the geometry. Tap any sector for its underlying aggregate detail and freshness.
recorded snapshots
Charts over time
Keep the same sector weather in view across the recorded sequence. Toggle between median and average lenses.
Trace the data. The public manifest and receipts describe the aggregate surface, timestamps and provenance.